Putting AI/ML models into production is a team effort. Multiple individuals are involved and it takes a great deal of planning and teamwork in order to deliver the project successfully. Each individual on the team needs a tool which allows them to keep track of the work their team members are performing. They also need to be able to identify dependencies to see how all of their applications are connected to each other.
With Syntasa, everyone on your team remains ‘in-the-know’ when building models and pushing them to production. Collaborating amongst team members is so much easier with our latest ‘Notes‘ feature, as teams can use notes to determine which applications are in production. The ‘Dataflow’ feature encourages continued collaboration by giving teams visibility into how applications are connected, and pinpointing their dependencies. Read below to learn how your Data Science team can work more collaboratively.
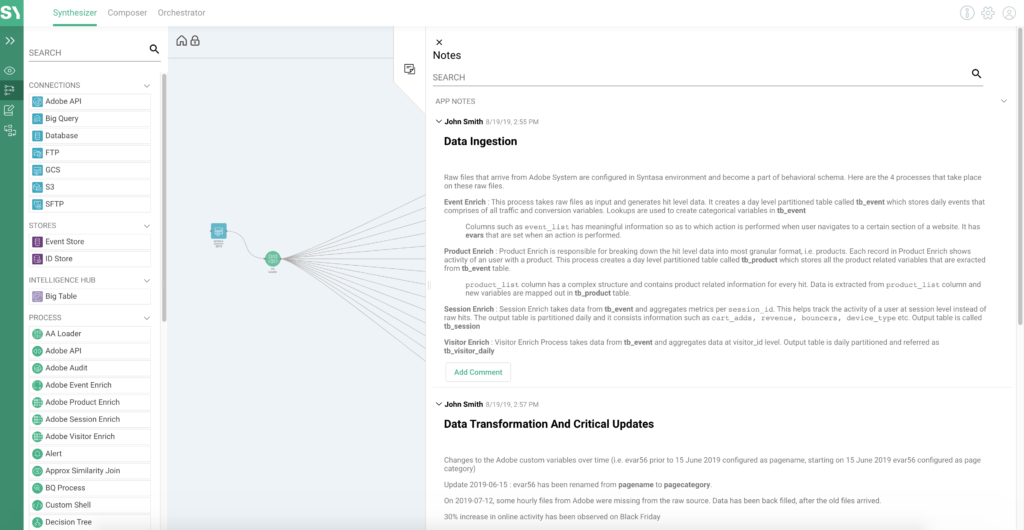
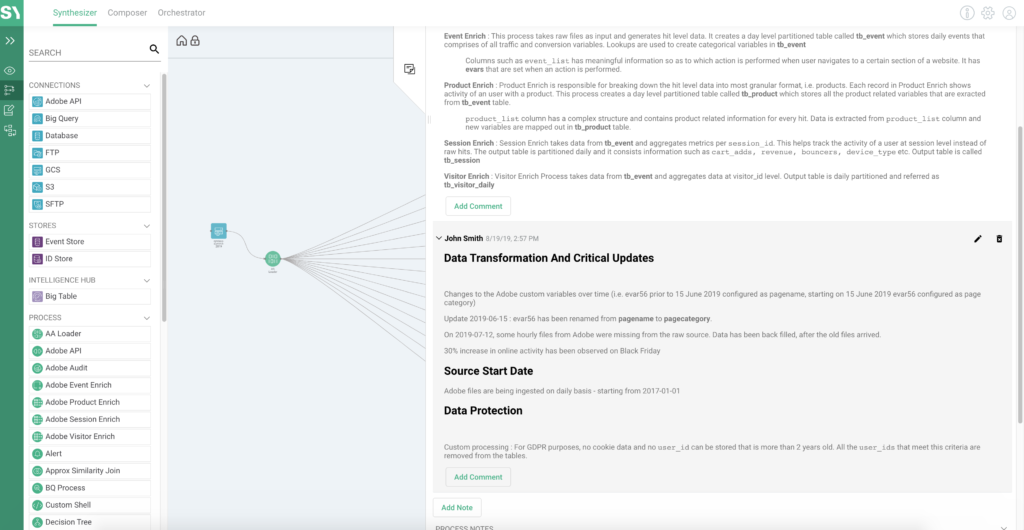
Keep Tabs on Your Team with Notes
As Data Scientists build models, there’s plenty of analysis that can get lost. A reference point is needed to capture the thinking and results as models are put into production. These notes will allow teams to review the team’s previous work should they need to revisit specific models to make any necessary changes. Notes can also help your team keep track of your applications and the work that members conduct. They can also let your data science team keep track of various applications that have been put into production, and team members can add comments to applications which will let everyone share information more effectively.
Producing Effective Data Flows
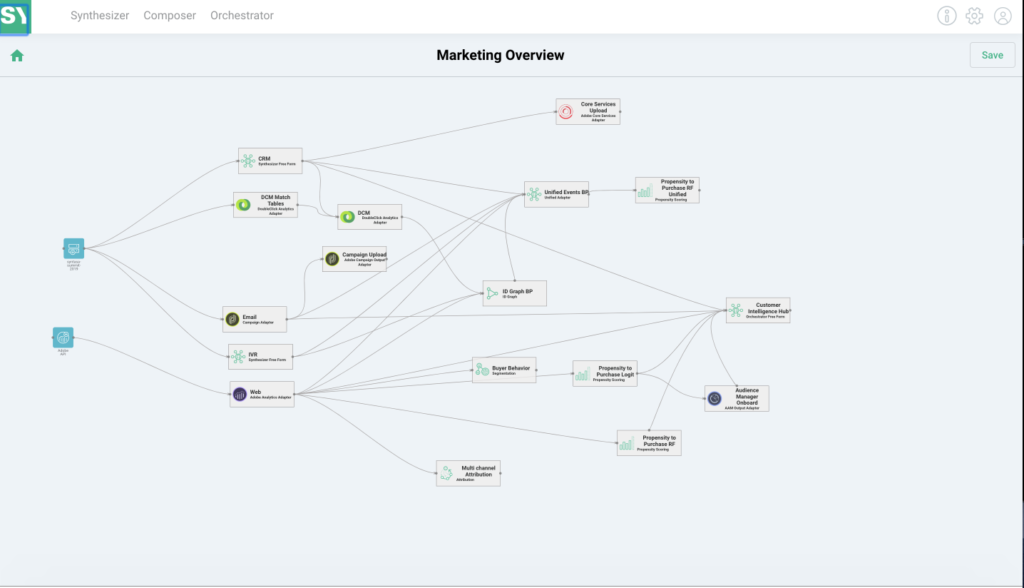
Collaboration in a Data Science team requires clear communication, along with an outline of the work that needs to be done. This can be difficult with varied teams consisting of Data Engineers, Data Scientists, Data Architects, and Developers. Typically, technical teams will begin to design a data flow diagram with a tool like Vizio. This method is limiting, however, as these data flow diagrams are just simple block diagrams. They don’t connect to the code that is later built manually. Once developers have begun to build the code assets, the architect of the data flow design may want to understand what was done throughout each step. Unfortunately, Vizio is not able to connect to the code and lacks a detailed view of accomplished tasks.
We at Syntasa view the world unrestrictedly. With our newest ‘app dataflows’ feature, teams can see how their apps connect by seeing all of their dependencies. This provides a high-level view of how data is flowing through your pipeline. While it may look like a Vizio diagram, it’s actually a programmatically generated overview of the applications in your system and how everything fits together.
With Syntasa, the system automatically adds new flows for you. As you add more apps, they automatically appear on the app dataflow diagram to show how they connect with one another. Unlike other systems, data teams can open an individual app from the app dataflow diagram and see how that app is configured. You’ll be able to understand how apps you’ve created function in your environment.
Tracking Your Data Lineage
In today’s environment, it is increasingly important to keep track of how your data is processed throughout your pipeline. And keeping track of which team member has made each change to your pipeline over time is a huge challenge. While some team members may have manually documented this, not everyone on the team may be aware of this fact. One approach to managing this complexity is to use a data catalogue. These catalogues keep a list of every table that was generated by every single app. However, they rarely keep track of the code that created those tables.
Syntasa allows you to manage data lineage and identify dependencies in a more comprehensive way. With Syntasa, you can inspect an individual app and view a programmatically-generated graph that shows each dependency. If teams want to examine a specific prediction and show how the related data was sourced and processed, they can view the lineage and trace it back. Simply pick a specific segment and view all of its dependencies.
Data science teams require the ability to collaborate to progress towards full production. Without helpful tools, teams will find themselves limited in their interactions with each other and their applications. Syntasa provides the collaboration capabilities your data science team needs to achieve meaningful results for your organization.