
Additional contributions by Stefan Broecker and Georgios Kourogiorgas
Black Friday and Cyber Monday have long been among the biggest online shopping days of the year in the United States. In recent years, these shopping holidays have also begun to spread worldwide. For online retailers, the Cyber Weekend between Black Friday and Cyber Monday provide a unique opportunity to engage existing customers and capture new digital footprints for future marketing efforts.
At Syntasa, we help companies analyze their customers’ unique purchasing journeys to better understand trends in user behavior and optimize marketing efforts accordingly, by using custom AI and machine learning models. Even micro-behavioral trends can have an impact on these models, which take into account thousands of individual touchpoints to predict user intent and outcomes.
We decided to analyze clickstream data from the 2019 Cyber Weekend to better understand typical customer journeys during this specific time period, and see whether there were any anomalies compared with typical purchasing journeys.
We were specifically interested in three questions:
- Growth in mobile shopping was widely reported, but how did desktop and tablet fare?
- Do we see an increase in same-day shoppers during the Cyber Weekend period? In other words, to what extent do deals drive impulse purchases?
- Does the research phase shorten or expand for customers shopping during the Cyber Weekend period vs. other times?
So we dove deep into the data from two Syntasa clients, both leading global brands: a consumer electronics company and a household appliances company to find the answers.
Behavior Across Device Types
Growth in mobile shopping over the entire holiday period (Thanksgiving through Christmas) was widely reported. We decided to dig into our data to see if this trend held true for them during the Cyber Weekend period in particular, and how that compared to desktop and tablet shoppers.
For each company, we compared their baseline year-over-year growth from the 2018 to 2019 Cyber Weekend periods to the growth in desktop-based, smartphone-based, and tablet-based sales, respectively.
As shown in the graphs below, desktop sales at both brands grew on a year over year basis, but more slowly than their respective baselines, while tablet sales at both brands shrunk on a year over year basis — significantly below their baselines. When it came to mobile sales, however, both brands enjoyed substantial growth above and beyond the baseline figure. For the consumer electronics brand, the percentage growth was a whopping 86%, compared to overall growth of 39%.
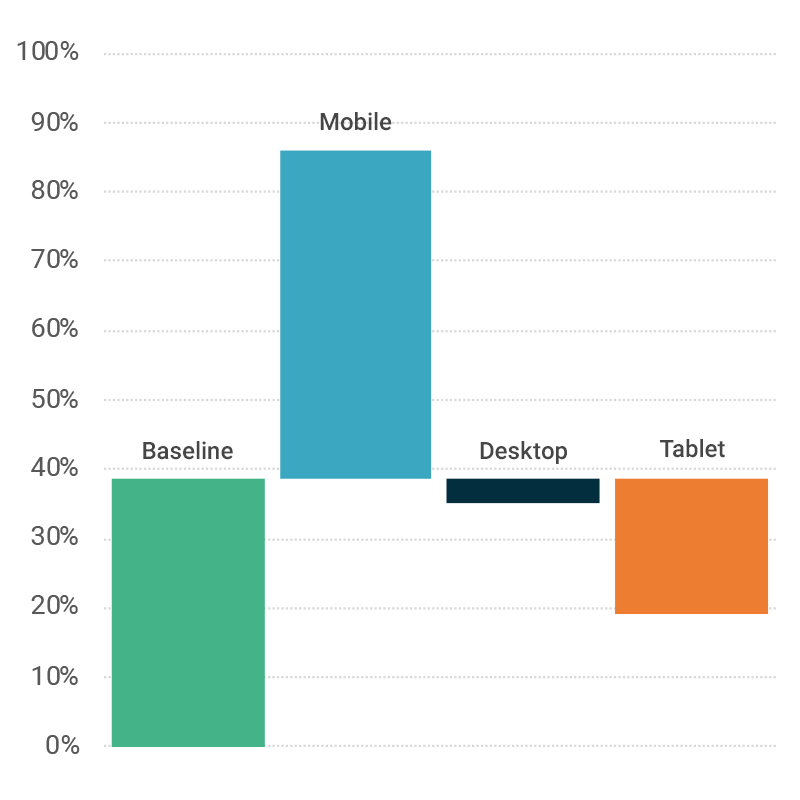
Consumer electronics waterfall chart
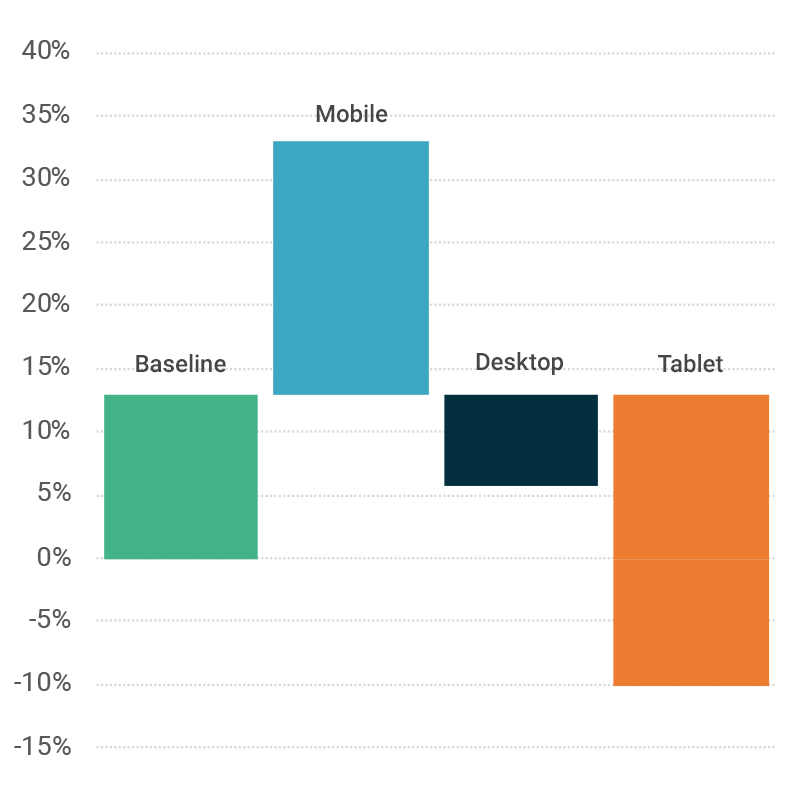
Household appliances waterfall chart
Trends in Purchasing Journeys and Buyer Behavior
There are many different paths to conversion — in some cases, shoppers will visit a site and buy a product immediately, while others do a lot of research before committing. We wanted to analyze the data from the Cyber Weekend period to better understand how, if at all, purchase journeys during this time differed from those during other periods.
To answer these questions, we first examined the distribution of visitors’ purchasing cycle lengths — in other words, when were Black Friday and Cyber Monday purchasers seen online for the first time? The graph below shows the distribution of visitors for the consumer electronics company on Black Friday. Day 0 in this graph is Black Friday, Day -1 is the day before Black Friday, etc. We used a lookback window of 10 days for this analysis. In this case, 61% of Black Friday were first-day purchasers (meaning they first visited the site on the day of purchase) — indicating that a majority of purchases were impulse buys.
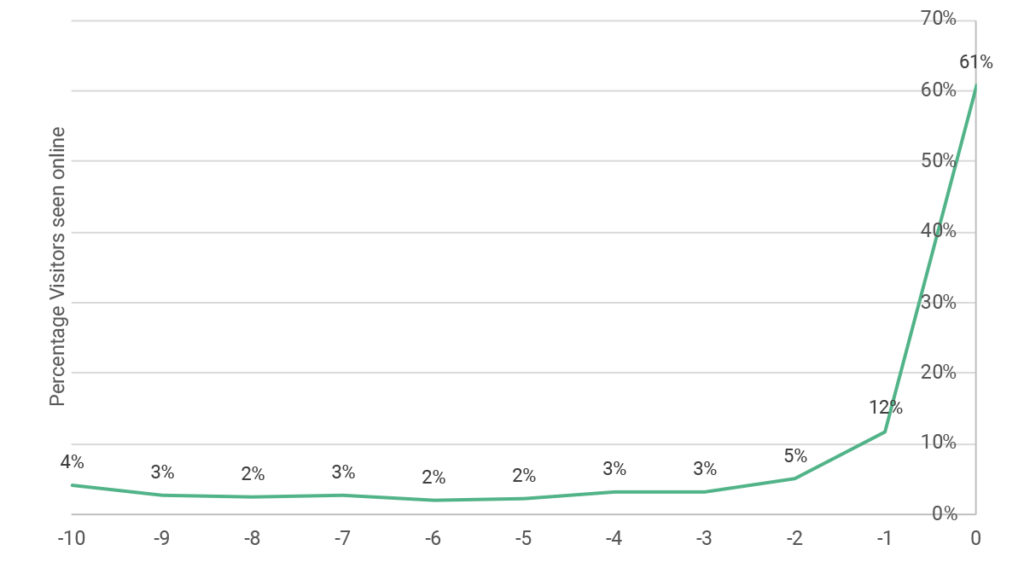
Distribution of visitors for consumer electronics company leading up to Black Friday
We then compared this distribution, as well as the distribution from the household appliances brand, to each brand’s baseline from the rest of November. The graph below shows the percentage of first-day purchasers for each day in the month.
Interestingly, we saw different trends across the two brands. The data shows a spike in first-day purchasers for the consumer electronics brand on both Black Friday and Cyber Monday, while shoppers at the household appliances brand seemed more likely to do their research in advance before purchasing.
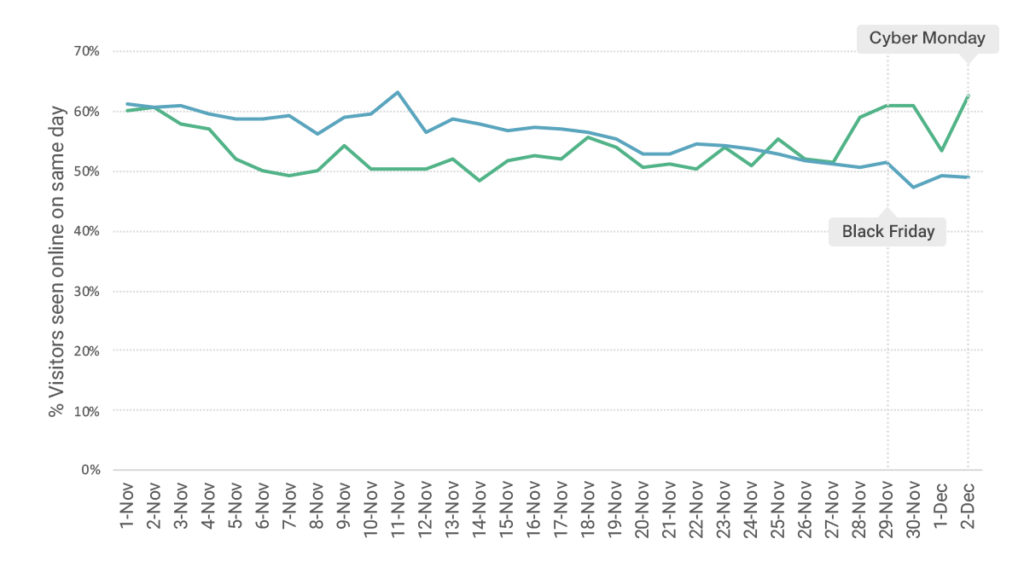
Percentage of same-day purchasers in November
Our final question concerned how the research phase for purchases during the Cyber Weekend period differed from typical shopping patterns during the month of November. To answer this question, we first established the baseline research phase for the month of November, showing the distribution of initial visits for each of the ten days leading up to purchase. Then, we compared this data to research phases on Black Friday and Cyber Monday for each brand. Note that both baseline and holiday data excludes first-day purchasers who did not visit the site at all in the days leading up to conversion.
The graphs below show our findings. For Black Friday purchasers, research phases for both brands held fairly consistently with the baseline. The largest number of buyers visited the site just one day before Black Friday. For household appliances, there was a larger spike seven days before Black Friday (perhaps this is when the brand announced its holiday deals).
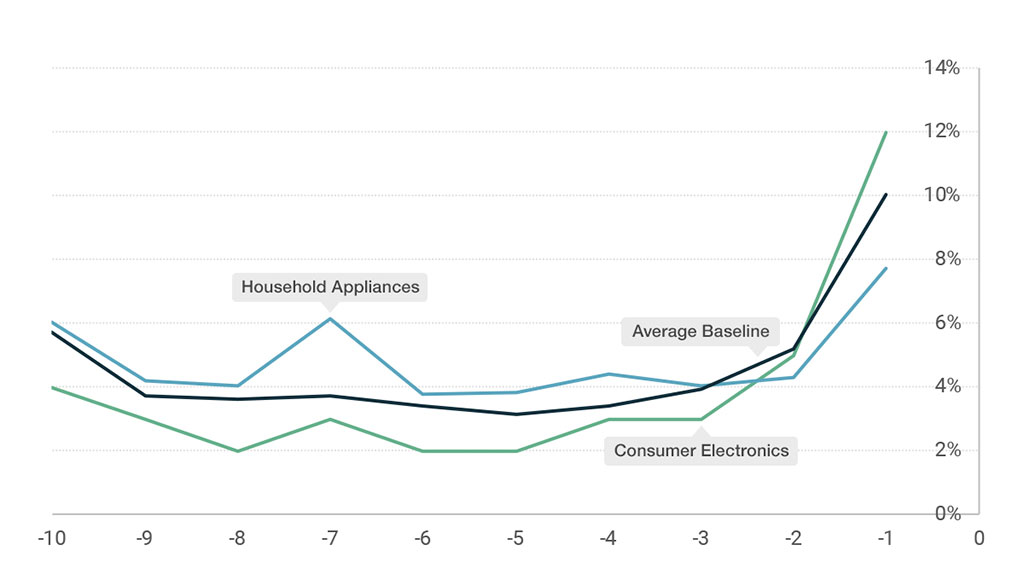
Research phase for Black Friday purchases
For Cyber Monday, however, research phases at both brands diverged significantly from the baseline three days before — which happens to be Black Friday. This suggests that purchasing behavior during the Cyber Weekend period varied widely from baseline as visitors start looking for deals on Black Friday, and returned on Cyber Monday to purchase. The number of people who visited the day before Cyber Monday was also much lower than the baseline for both brands.
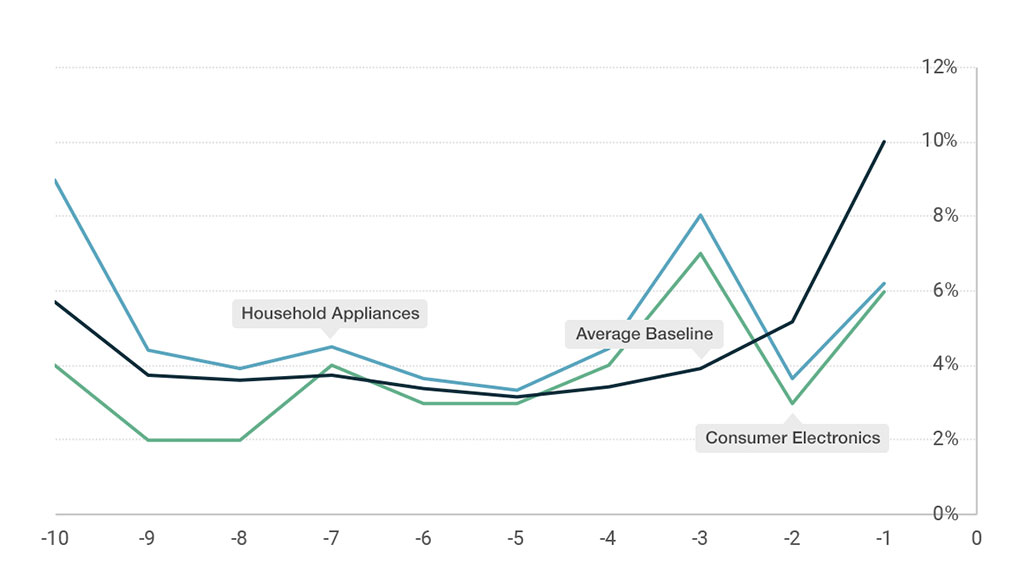
Research phase for Cyber Monday purchases
The four day period from Black Friday to Cyber Monday is hugely important to online commerce. Twenty percent of overall holiday traffic comes during these four days. It is a huge opportunity for brands to capitalize on that traffic by developing and acting on a deeper understanding of their buyer behavior. Of course these kinds of insights don’t happen overnight, so make sure you get started soon if you want to be in the position to capitalize in 2020.
Note: all analysis was performed using the Journey Analytics capabilities in the Syntasa platform.